Convenience Store Industry 101
$CASY, $MUSA, $ARKO, ATD.TO, TYO:3382, $DINO, $PARR, PKI.TO, $VLO
In March 2024 I wrote an article about the Automotive Dealership Industry. In that article I explained the importance for an investment thesis of carrying out a sectorial analysis and of understanding “how the sector is structured, what the most relevant players are and what trends and risks could drive or derail its future performance”.
As I also explained there, I tend to include this analysis as part of my theses but this time I decided to follow a different approach: start by analyzing the sector before focusing on any specific company. I like this approach more and more because it often helps to make a better decision about which company to analyze before jumping into any specific company.
Today I’m repeating this process with the Convenience Store sector and, in that sense, the idea of this article is to serve just as an introduction for subsequent analyses in which I expect to dive deeper into concrete public companies within the sector.
Zooming Out Before Zooming In
Convenience stores can be defined as “retail establishments that offer a wide range of everyday items in a convenient location. From snacks and beverages to household essentials and fuel, these stores cater to the needs of busy consumers looking for quick and accessible shopping solutions”. In that sense, the genesis of the convenience store is not actually connected to the oil sector. However it is undeniable that the expansion of the sector is inextricably linked to the combination of gas stations with convenience stores and, in order to better understand this industry, it might be useful to see where convenience stores are located within the broader oil supply chain:
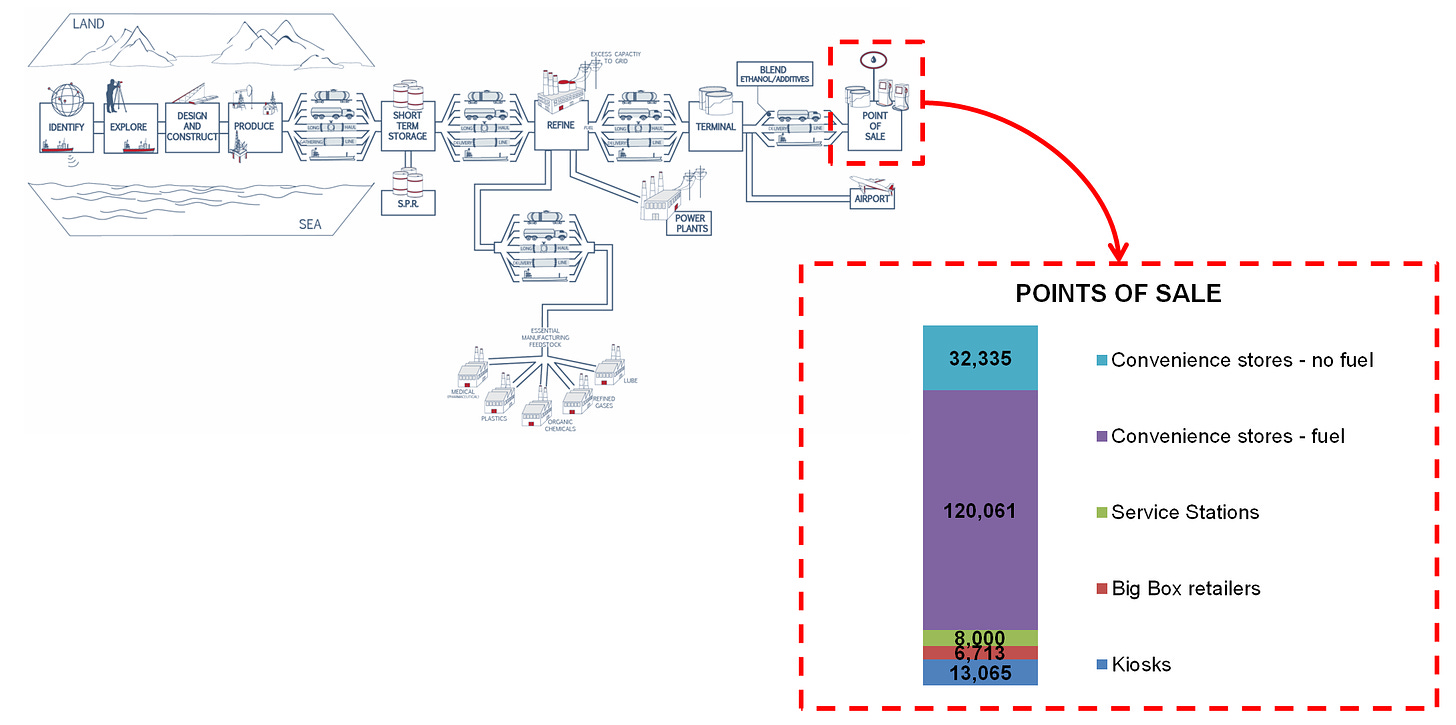
As we can observe, convenience stores are located at the very end of the oil supply chain, once the refined fuel leaves the terminal and the final product is delivered to the end user. In the U.S. there are ~147,000 gas stations, of which 120,061 are convenience stores. The remainder points of sale are basically service stations (~8,000), kiosks (13,065) and hypermarkets/big-box retailers like Costco or Walmart (6,713). There are other 32,335 convenience stores that don’t sell fuel (~20% of the total), to complete a total count of 152,396 locations (end 2023).
Key Features of the Industry
Industry Composition
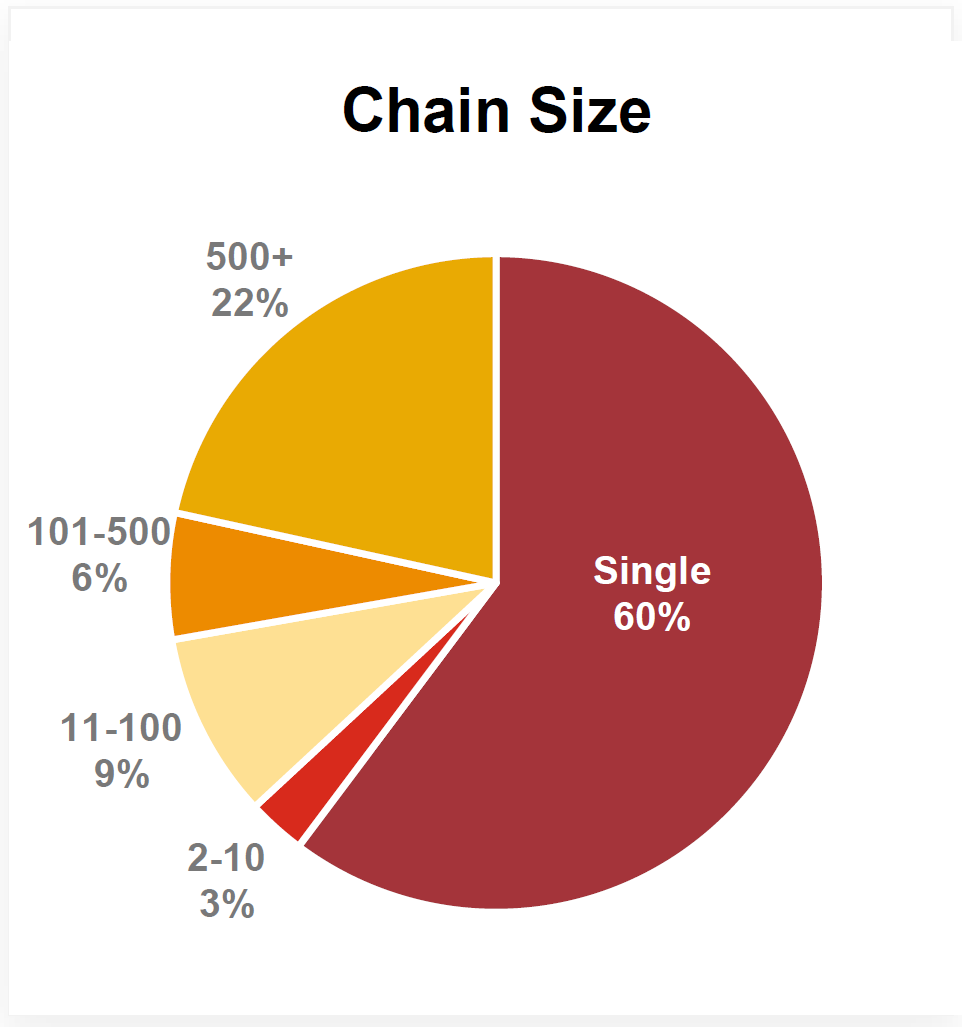
The U.S. c-store industry is highly fragmented. Indeed “more than 60% of the retail stations in the US are owned by an individual or family that owns a single store”:
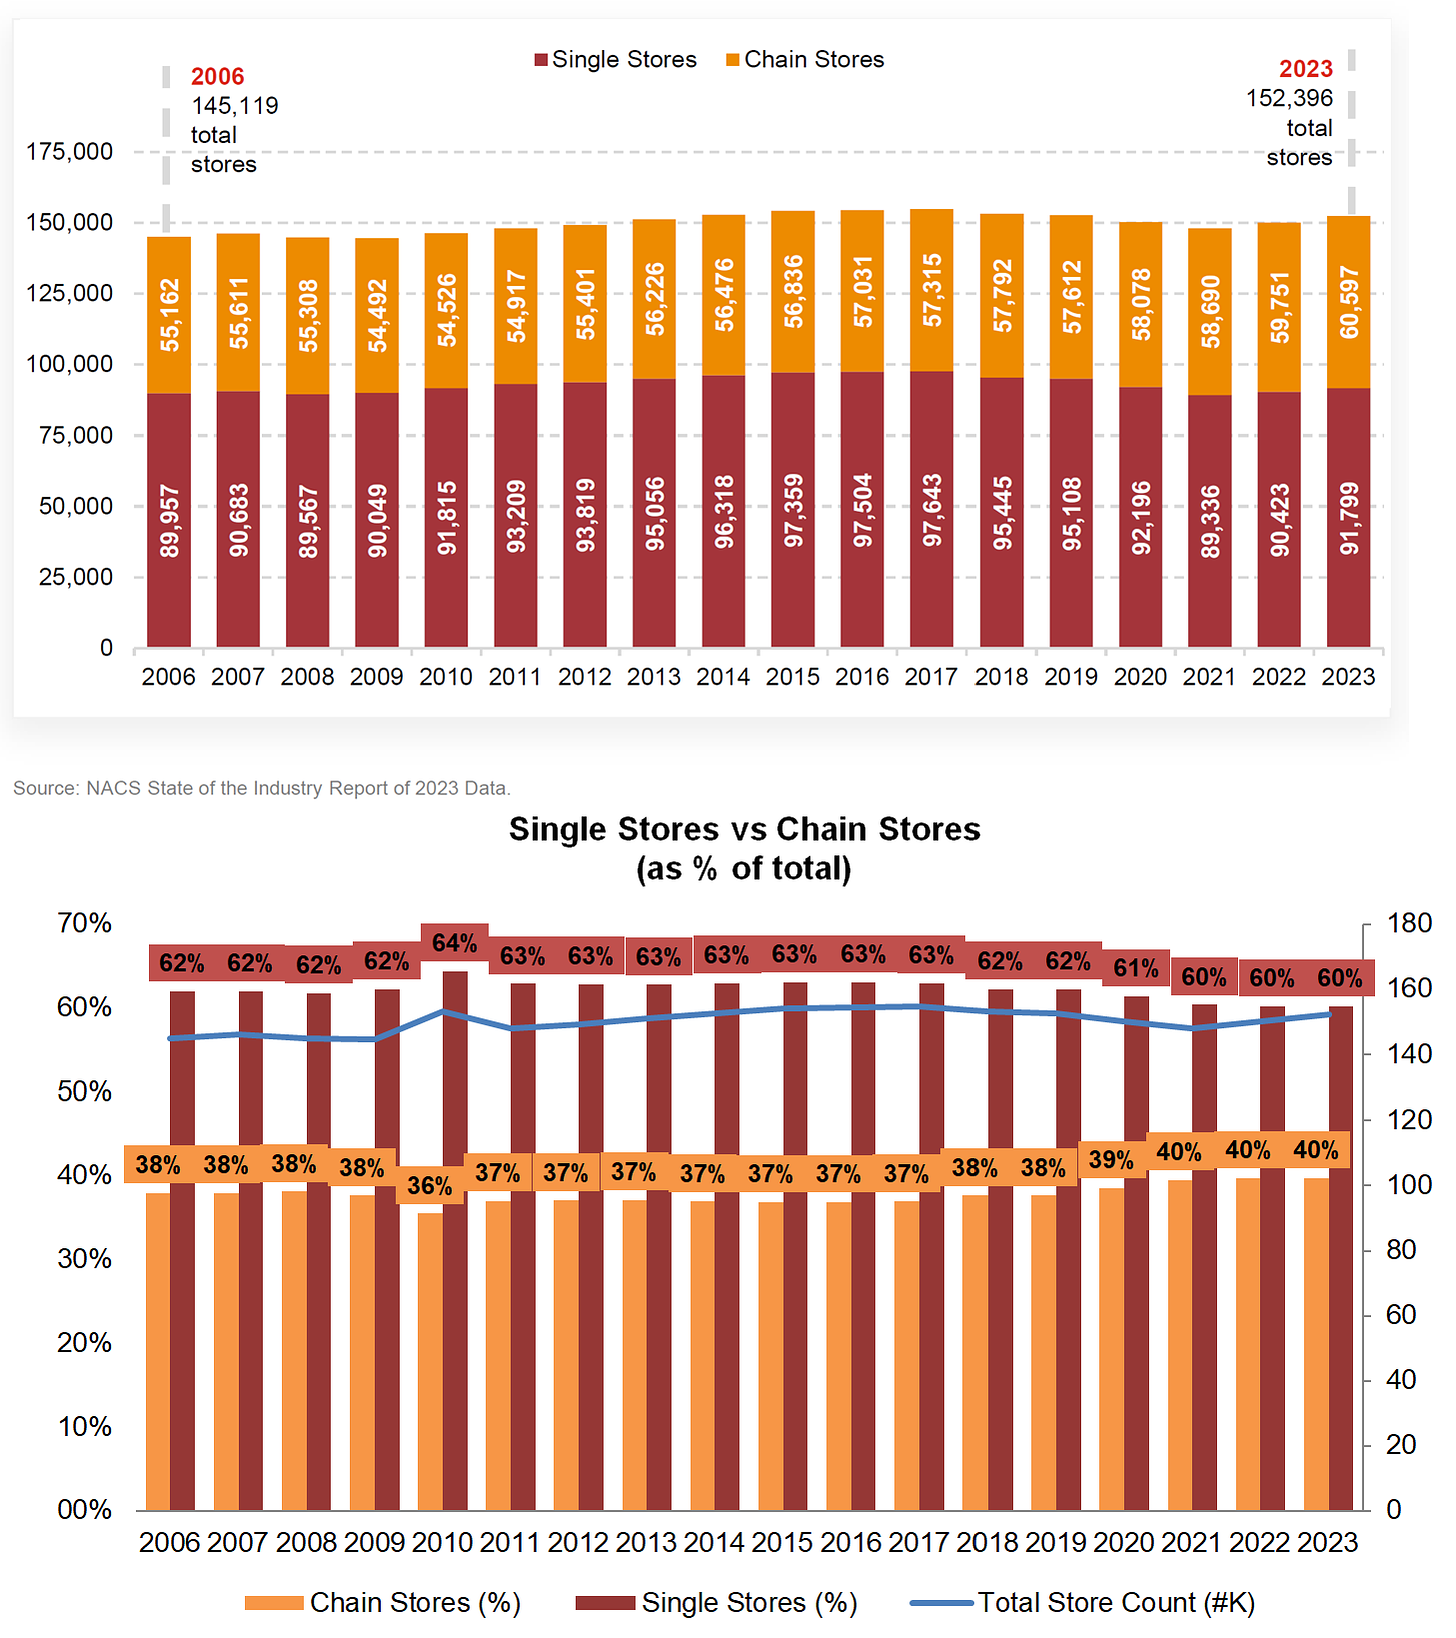
This high fragmentation leaves ample room for consolidation (see Some Industry Trends & Risks below). However, the consolidation process within the sector, which started in the 90s, has progressed slowly:
There are two main factors that have made this process to advance slowly. On the one hand, the relatively few economies of scale, as big chains pay similar prices than single operators for their fuel, labor, real estate, utilities, etc. On the other hand, single-store operators have learned how to adapt and pass through the impact of cost increases and lower volumes, being able to effectively compete with larger chains. In that sense, until now most of the consolidation has taken place among mid-sized and publicly traded c-store chains but not among single store operators.
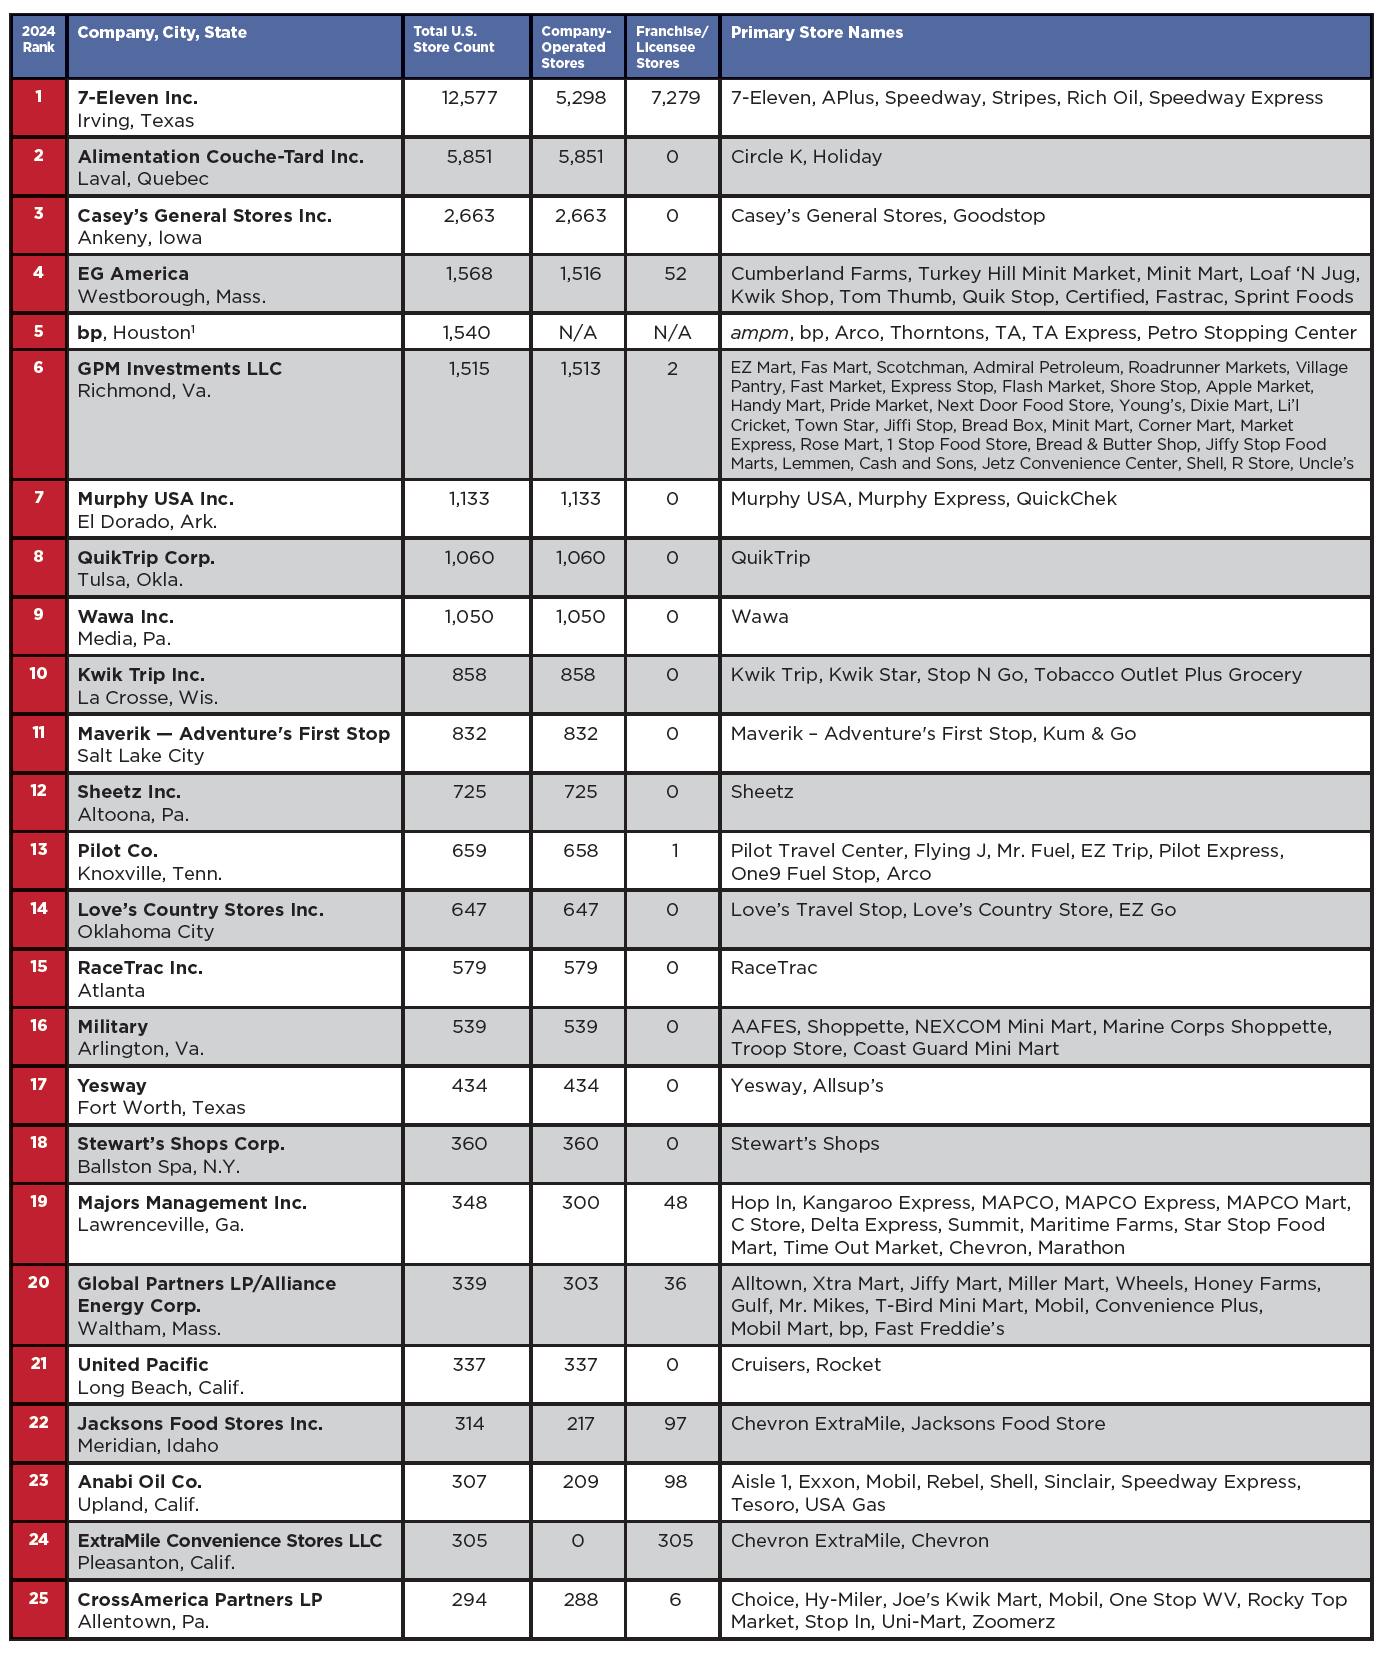
As it can be observed in the previous chart, only 40% of convenience store locations are owned by an operator with more than one store and the top 25 players within the industry, which are a mix of private and public convenience store retailers, represents just 24% of total store locations:
Revenue Structure and Profit Centers
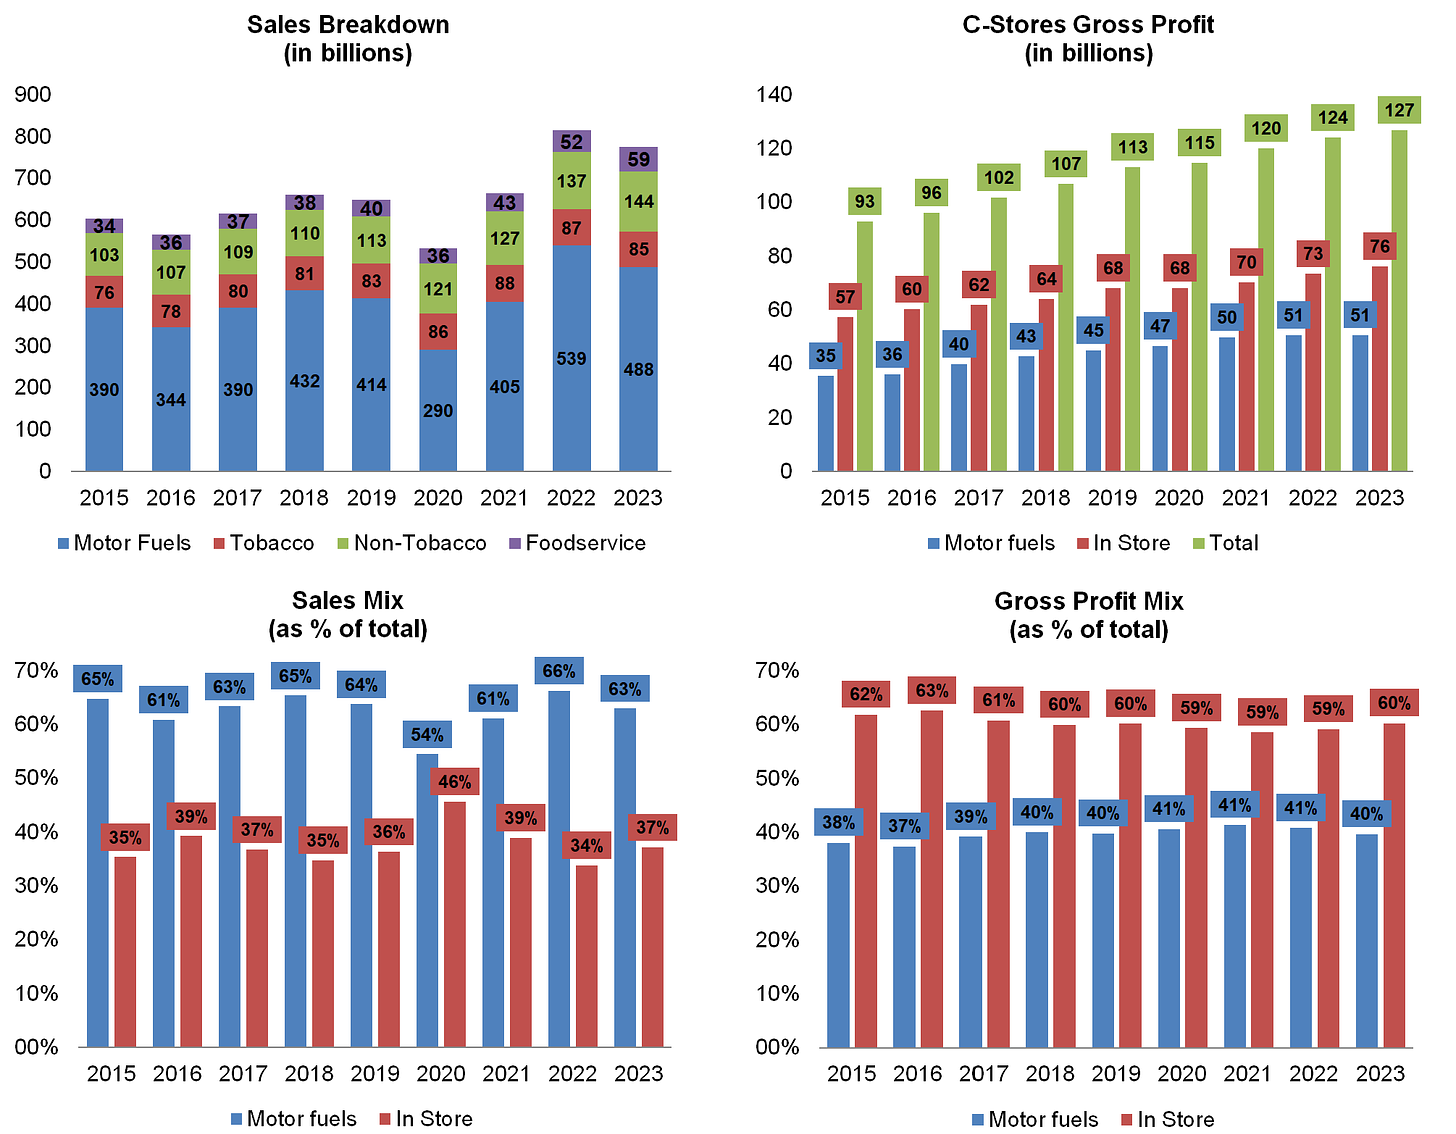
Convenience stores make money through a diversified business model that mixes high-margin categories (like foodservice) and high-volume, lower-margin items (like fuel). Following the NACS’ classification, those categories can be grouped into two large groups: in-store sales and fuel sales. The in-store category comprises a group of heterogeneous categories which have in common basically that are not fuel. As the idea of this article is not going one by one through each category that comprises in-store sales, let’s make an additional distinction just between foodservice (i.e. basically prepared food and beverages) and general merchandise, and, within the merchandise category, between tobacco and non-tobacco products (i.e. packaged snacks and beverages, beers, candies, etc.):
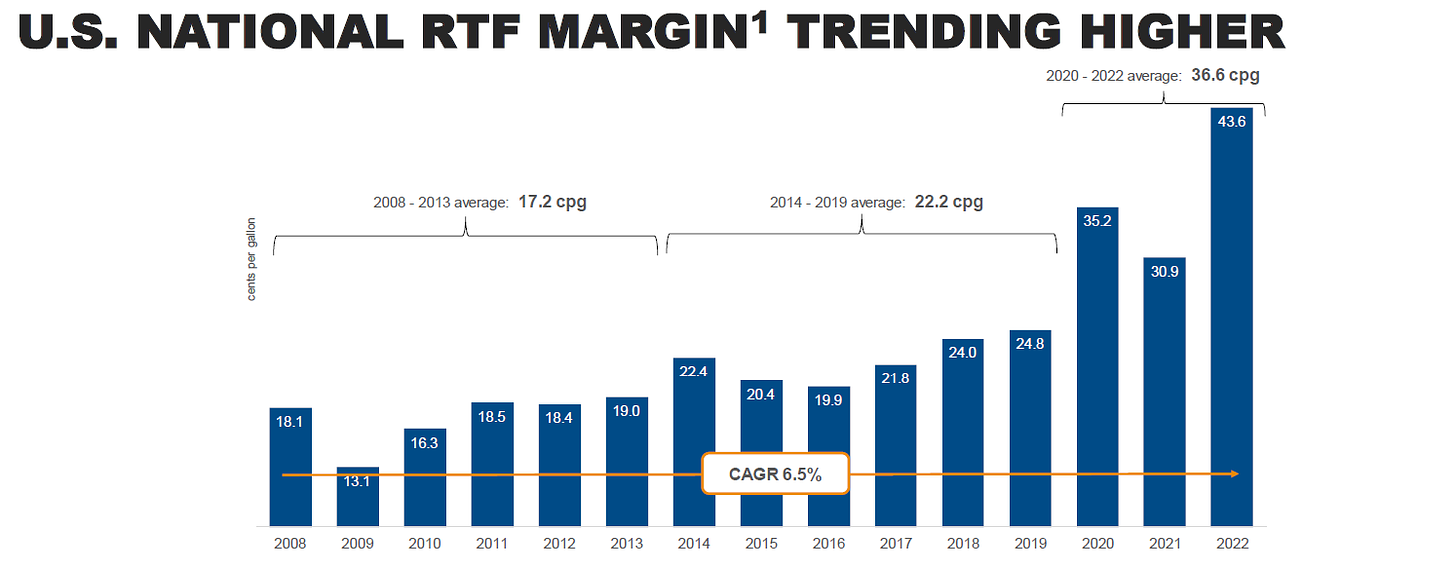
Motor fuels represents the most relevant category in terms of sales (~63% of total sales in 2023). However fuel is a high-volume, lower-margin item, and it represents less than 40% of total gross profit. Indeed, if we look at the breakdown of where the money goes when someone buys a gallon of gas, the gas station profit per gallon is tiny:
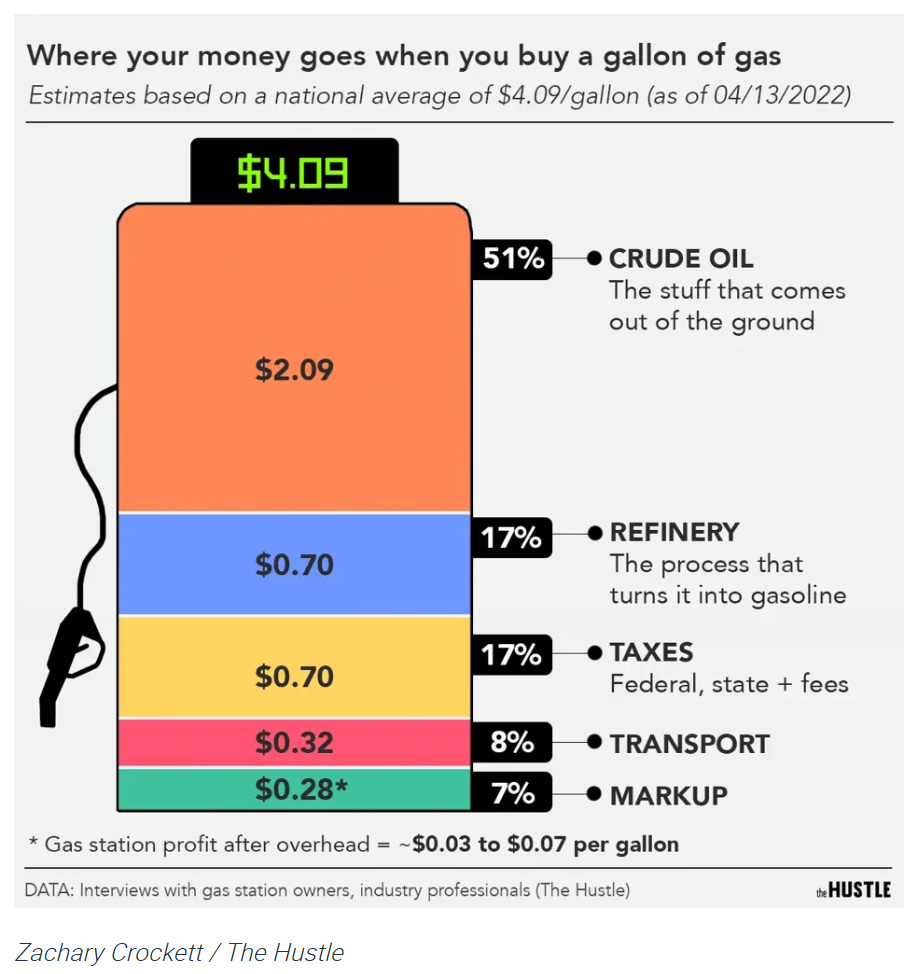
This is a category that faces many structural headwinds (see Some Industry Trends & Risks below) but c-stores have been able to keep and even increase its gross profits. Gross margins per gallon have generally increased over the years, even during periods of lower total sales volumes, highlighting improved profitability for retailers despite fluctuations in fuel volumes.
Additionally, fuel sales are critical for attracting customers, especially commuters and travelers, although the profitability of c-stores’ business model relies on getting fuel customers to enter the store for higher-margin items.
Tobacco is a really interesting category because, despite the general feeling that U.S. smoking rates are steadily declining (which is true: tobacco units have been in decline for 40 years), those products continue to be a huge driver of c-store sales and profits. Why is this the case?
There are two important points that help understanding this situation:
While cigarette units sold have been steadily declining, c-stores have been able to keep sales rising thanks to price increases that have been passed through to final customers and offset the diminishing number of units sold.
Additionally this unit sold declining has been partially offset with the increase of other tobacco products (e.g. vaping products, electronic cigarettes or smokeless tobacco). These substitutes are on the rise, indicating a shift in consumer preferences away from traditional smoking towards nicotine alternatives that are perceived as less harmful. Besides those products are much more profitable than cigarettes (~25% margin vs ~15% cigarettes).
Keep reading with a 7-day free trial
Subscribe to JustValue to keep reading this post and get 7 days of free access to the full post archives.


